

The Battle for the Iron Throne
A changing venture capital landscape

The Genesis
Since entering the venture capital industry, it’s astonished me how few investors “take out their microscopes” and point the lens at their own industry. On the whole, venture firms lack differentiation, struggle to scale, and have been overly confident about future returns based on historical success. What initially made me interested in writing on the topic was the increase in competitive dynamics that have become more and more apparent over the years. I’ve been procrastinating publishing my personal views on the changing venture landscape for quite some time, but after reading Everett Randle’s Playing Different Games I figured it was worth putting some virtual pen to digital paper.
If you’re looking for a follow-up article to Everett’s to dig deeper on growth rounds and help inform your next growth bet, this is not the article for you. Instead, I’ve taken a one thousand-foot view of the landscape in an effort to dissect how major industry changes, including the better/faster/cheaper model of investing, is shifting industry equilibriums. Before we really dig in, I want to state up front that, on average, I believe venture capital is a mediocre asset class. For North American funds created between 2009 and 20131, average internal rate of returns (IRRs) were 14.30% with an average TVPI (total-value to paid-in capital) of 1.84x2. However, for limited partners (LPs) of top quartile funds, the story is quite different. Over the same period of time, top quartile funds generated an average internal rate of return of 25.90% and an average TVPI of 2.59x3. For anyone familiar with venture, this shouldn’t be a surprise as venture capital is a power law game, meaning a small portion of a fund’s invested capital, generates a materially outsized amount of proceeds. When looking past the top quartile and instead focusing on the top decile funds, the power law dynamics become even more obvious as the average IRR and TVPI over the same time period of top decile funds is 38.1% and 3.22x, respectively4. As such, venture capital has one of the largest standard deviations of returns in comparison to other asset classes (Figure 1).

Figure 1: Dispersion of Returns in Various Asset Classes.5
The Caving Ceiling
Now that we’ve gone through the early disclaimers, let’s have some fun. Continuing on Everett’s Game of Thrones’ metaphor, where he compared the fighting styles of Bronn and Ser Vardis, I view the entire venture landscape as Westeros, the continent in the story where most of the action takes place. The goal for most of the key players in Game of Thrones was to take over the Iron Throne and rule the land. In the venture world, the “Iron Throne” is the aggregate returns of the industry, which, for the sake of this discussion, we’ll assume is finite. Therefore, all investors are chasing to own as large of a percent of the total returns in the industry as possible. By doing so, they’ll push themselves into the highest quartile group and potentially into the top decile, where the strongest returns are generated.
First, let’s look at the Bronns of the world, Playing Different Games than the Ser Vardises. Everett describes Tiger Global as Bronn, taking a different approach to competing than the traditional venture capital firms. While Tiger Global was the primary example in his essay, the description includes the whole cast of crossover investors, including Coatue Management, Altimeter Capital, Dragoneer Investments, D1 Capital Partners, Addition, and more. These buy-side public equity asset managers are playing a larger role in the private markets as they battle for their seat on the Iron Throne. The scarcest resource in venture is not capital, but rather access. These crossover investors understand that and are willing to pay a premium relatively early in a company’s life cycle to have access into the pre-IPO rounds. This has led to crossover investors participating in 74% of the pre-IPO rounds for companies that went public in 20206. Everett dives into why these crossover investors are able to play a different game, but he does not touch on the systemic drivers.
The SEC enforces rules and regulations that were largely developed in 1940 or earlier, with few amendments to date7. As is the case with most regulation in a capitalist economy, this forces a new equilibrium that is not in line with the desired end state when these “laws” were initially instituted. Ultimately, companies aren’t rushing to go public and face the scrutiny of the SEC and, as such, have stayed private significantly longer. In fact, the median age of a company going public has risen from 7.9 years between 1976 and 1998 to 10.8 years between 1998 and 20198. The 37% increase in pre-public lifetime of a company means that more value appreciation is occurring in the private markets than ever before. As such, these crossover funds are looking to acquire as much of the value appreciation as possible, and are increasingly looking to the private markets to do so.
Another key variable driving the increase in competition in the private markets is the debt markets, which have seen yields near zero, forcing investors to look elsewhere for returns. Since the Global Financial Crisis (GFC) we have seen lower global rates driving an estimated $17T of negative yielding debt9. When we pair this with an unprecedented level of fiscal and monetary stimulus on a global basis, due to COVID-19, the trend is rapidly accelerating. While the U.S. 10-year Treasury, which opened 2020 at 1.9% and went as low as 0.5% in the year, should sound alarms, the Federal Reserve is “not even thinking about thinking about raising rates”10. Ultimately, this will force investors to reassess their portfolio allocation and search for alternative sources of returns beyond the debt markets, which had been in a bull market for the past few decades. A key thing to note is that the equity markets are inherently linked to the debt markets. In fact, potential equity returns are typically calculated by summing the risk-free rate and a risk premium. As the risk free rate approaches 0%, investors will need to fill in the gap by investing in riskier assets with higher risk premiums. Therefore, these low interest rate environments are forcing all investors to push out further along the risk curve to achieve the same level of returns. This flood to equities has been a major driver of the strong equity markets we have seen throughout the past year, even while much of the world is locked down.
Historically, value investments have outperformed growth over a long period of time. However, when looking at the Bessemer Emerging Cloud Index since the start of COVID-19 pandemic, we are seeing something different. Putting on my banker hat for a minute, with significantly lower costs of capital, associated with near-zero rates, a company’s future cash flows are being discounted at lower rates which is why we’re seeing such a large appreciation in value. These “growth stocks” are inherently riskier, as many are not cash flow positive today, which investors are now willing to own to drive their desired returns. We are seeing a true blurring of public and private markets, which is likely to continue as investors are willing to take on additional risk. This is evident with Pension funds who have increased their allocation in alternative assets from 7% in 1990 to 29% in 2019, with approximately 40% of institutional investors planning to further increase their exposure11.
So is that the end of the story? Are crossover investors going to become the dominant player in growth investing? I believe there’s an army in this war, that is relatively unknown yet battle ready, that has a real chance to sit on a portion of the Iron Throne - non-dilutive investors. When thinking about non-dilutive investment platforms, such as Clearco (formerly known as Cleabanc) and Pipe, and comparing their offerings to crossover investors, it’s actually quite similar. While crossover investors are offering low dilution, through largely over-priced rounds, Clearco and Pipe are offering zero dilution. In both cases, investors are largely hands-off from an operational perspective and playing at the heart strings of founders’ high levels of sensitivity to dilution. Simplistically, Clearco provides revenue-based financing where they quickly calculate the benefit of $1 of marketing spend for a company (historically e-commerce brands) and if the revenue generation potential is greater than $1, Clearco will finance the company to drive growth. While this offering is interesting, it’s largely undifferentiated as many revenue-share models exist, which is why the company focuses on offering a variety of ancillary services and rebranded from Clearbanc to Clearco. The company used their revenue-based financing platform as a wedge into a larger ancillaries market.
In comparison, Pipe creates an entirely new asset class out of recurring revenue by providing high quality companies with upfront capital (at a slight discount) to their annualized monthly recurring revenue. On the other side of the marketplace are high quality investors who have a lower cost of capital than the companies and, can therefore, fund the upfront capital to make money through arbitrage as they receive the monthly recurring revenue throughout the year. In a world being consumed by software, which typically charges based on a monthly SaaS fee, Pipe is incredibly well positioned to provide venture-backed founders with the growth capital they need without taking on dilution. Pipe does not only serve SaaS businesses, but rather any business with recurring revenue, including property management companies, direct to consumer physical product subscriptions, telecommunications, sports and entertainment, biotech, healthcare, venture capital management fees, and more. Pipe has used venture-backed SaaS businesses as a massive wedge into the larger funding market. In comparison to Clearco, Pipe’s wedge is so large that you’d need a sword made from Valyrian steel to slice through it.
When looking at the history of venture capital it’s clear why most startups had to sell equity in order to fundraise; startups were seen as highly risky investments with minimal collateral. Therefore, banks were not willing to lend to the founders, which opened an opportunity for forward-thinking high net-worth individuals to fund these innovative startup ideas. Today, the story is materially different with a significant amount of data points proving not only that startups can be successful, but that they can dwarf incumbents quite quickly. As the bet on startups proves to be significantly more de-risked than investors once thought, I expect to see the continued emergence of new alternatives to equity funding. Non-dilutive solutions, like Pipe, bring scale to an asset class that has historically been unscalable and solves many of the key issues of “the growth round” product. Without the dependence on traditional venture funds for growth rounds, founders are able to scale their business, choose top early stage VCs to sit on their board, and exit with significantly more ownership than if they had funded their growth through equity. For the most part, companies raising growth rounds are taking significant dilution to essentially pay Google and Facebook for their customer acquisition (via advertising). By providing a significantly cheaper form of funding for their marketing budget, companies can grow more efficiently, which ultimately benefits both investors and employees.
The Rising Tide
Shifting to the other side of the funding landscape, there’s been an incredible amount of activity occurring at the earliest stages in the private markets. After a short lull at the beginning of the pandemic, angel, pre-seed, and seed deals awakened, resulting in a record year, which continued into Q1 2021 with the highest quarterly total on record (Figure 2)12.
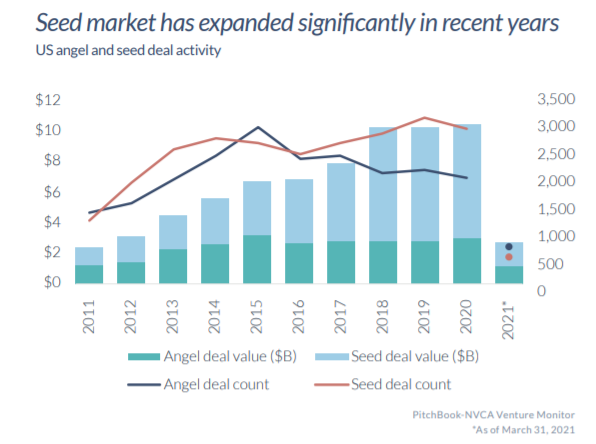
Figure 2: Angel and seed financings over time.
Angel investments reached $1 billion in deal value in both Q4 2020 and Q1 2021, the only two quarters to top that mark as angel investments averaged $700 million between 2016 and Q2 2020, highlighting the clear demand by investors who have moved upstream, participating further out along the risk curve13.
Unlike venture, growth, and late stage rounds, whose deal sizes and valuations tend to vary considerably, angel and seed financings have historically been more formulaic in nature. That being said, the increasing demand and risk appetite that has fundamentally changed later rounds, are beginning to creep into these seed rounds, with median seed deal sizes rising to $2.6MM in Q1 202114. The increasing demand by investors to gain exposure into these rounds has resulted in the third consecutive quarter of deal count growth in initial company fundings. As a result, more companies are being funded than ever before, resulting in an increasing number of companies entering the venture cycle, ultimately expanding the supply of target companies for investment purposes.
There’s a variety of factors that are driving this movement to angel, pre-seed, and seed rounds, with the most important being increasing levels of competition. AngelList’s Syndicates and Rolling Funds have significantly lowered barriers and friction to investing into the private markets, bringing more capital and eyeballs into these early rounds. While the syndicates and rolling funds have increased competition at the angel and seed rounds, less of this is spilling into the Series A, where larger funds with more established track records have been able to outcompete and gain access into top deals.
Another more recent source of capital for early-stage companies is through equity crowdfunding, where SEC regulations have changed to allow a company to raise up to $5MM through equity crowdfunding efforts per year15. These new rules allow non-accredited investors to gain exposure into the private markets, while allowing early-stage companies to widen their cap table to a variety of potential stakeholders, including their users. A notable example of this is Gumroad, a startup founded by Sahil Lavingia, that helps creators sell their work, and raised $5MM of their $6MM fundraise through Republic. Other notable companies providing equity crowdfunding opportunities include WeFunder, StartEngine, and SeedInvest, which are all increasing the level of competition in the private markets leading to the potential of reduced dilution for founders. These factors, among others, have driven a divergence in deal size between angel and seed deals, as the competition has skewed more towards seed rounds, where early indications of commercial traction and product-market fit tend to exist (Figure 3).

Figure 3: Divergence in median deal size between angel and seed rounds.
However, in terms of valuations at angel and seed rounds, these have stayed relatively steady over time due to the formulaic nature of evaluating these companies, which often are pre-revenue and sometimes even pre-product (Figure 4). This fosters an environment where more companies are funded over time, providing more choice for traditional Series A investors, which, in theory, should result in superior returns.

Figure 4: Angel and Seed valuations remain steady.
Pressure Makes Diamonds
As an early stage investor, primarily focused on Series A, I wanted to better understand how the dynamics at the angel, pre-seed, and seed, as well as the dynamics in growth rounds, affect my returns and if these changes affect who will ultimately sit on the Iron Throne. High priced valuations at the growth stage, non-dilutive alternatives to growth rounds, and soaring exit multiples are driving a ripe environment for strong returns for early stage investors. Early investors are receiving large markups for their portfolio companies, which helps them raise additional funds, driving a larger amount of management fees and a higher likelihood of generating significant carry. Additionally, similar to founders and employees, early investors benefit from the reduced dilution associated with high growth valuations and/or non-dilutive funding, which leads to a larger ownership position at exit. For many technology startups, they are also seeing multiple expansion at exit as investors continue to choose growth over value.
On the other end, a larger number of funded angel, pre-seed, and seed companies provide an environment where Series A investors have more choice and, in theory, should have to compete less on valuation. Early stage venture has functioned from a position of strength in Q1 2021, as $14.5B of early-stage capital was invested in an estimated 1,170 deals16.

Figure 5: Early Stage venture activity tracking to set a record in Q1 2021.
With dry powder still sitting at all-time highs, and a record level of VC fundraising in 2020, early-stage funds have continued to invest aggressively through the pandemic. This has resulted in a strong upward trend of both deal size and valuation into Q1 2021 (Figure 6).

Figure 6: Early-stage venture deal size and valuations climb to record heights.
If we look at the above data in a silo, we might come to the conclusion that this is actually a very difficult time for Series A investors, who are receiving less ownership for the same investment amount as in previous years. However, due to the previously mentioned dynamics taking place in growth and late stage rounds, valuations are rapidly being marked up with insiders receiving less dilution for a given growth round than in previous years. Since we are seeing a higher percent increase in valuations taking place in growth rounds versus Series A, we can conclude that even though Series A investors are paying a premium to historical valuations, they actually are exiting businesses and driving higher returns than in previous years as they receive less dilution in follow-on rounds.
Overall, the venture industry is in a state that we have never seen before, and the shifting equilibriums will create new winners and losers, ultimately fighting a gruesome war to sit atop the Iron Throne. While we cannot truly predict whether the winners will come from the North, the South, the East, or the West, what we ultimately know is that “Winter is Coming” and the battle for the Iron Throne has only just begun - unless Jerome Powell and his army of White Walkers attack.
Focused on funds between 2009 and 2013 as these vintages are post-Global Financial Crisis and have had enough time to generate returns.
Pitchbook: PitchBook Benchmarks as of Q3 2020 (North America).
Pitchbook: PitchBook Benchmarks as of Q3 2020 (North America).
Pitchbook: PitchBook Benchmarks as of Q3 2020 (North America).
Seth Levine’s VC Adventure: VC Fund Returns Are More Skewed Than You Think.
Pitchbook: Crossing Over Into Venture.
John Street Capital: Investing & the Convergence of Public & Private Markets.
John Street Capital: Investing & the Convergence of Public & Private Markets.
John Street Capital: Capital Allocation & Risk Asset Ramification in a 0% Interest Rate World.
John Street Capital: Capital Allocation & Risk Asset Ramification in a 0% Interest Rate World.
John Street Capital: Capital Allocation & Risk Asset Ramification in a 0% Interest Rate World.
PitchBook: Q1 2021 Venture Monitor.
PitchBook: Q1 2021 Venture Monitor.
PitchBook: Q1 2021 Venture Monitor.
Tech Crunch: Gumroad wants to make equity crowdfunding mainstream.
PitchBook: Q1 2021 Venture Monitor.